Brew Control Chart
🗺️ The treasure map to your golden coffee
Introduction
Brew Control Chart is a good tool for visualizing your brew result and point the direction for improvements if you know how to move on it. It’s like a treasure map guide you to the gold. By marking your current location (Start) and your target location (Treasure), and successfully move your point to the target position, you will finally be able to find your golden coffee.
There is already plenty of articles introducing the history of this chart, so we are not going deep in this part. You can read more about it from the articles in reference
Today we are just focusing on how to use this map:
📍 Where am I?
How to get my coffee onto chart
The Brew Control Chart evaluate your coffee from two dimention:
- TDS - Total Disolved Solid, represents how much substance you have in your yield
- EXT - Extraction Rate, represents how much substance you have extracted from dose
You can get the TDS (Total Disolved Solid) easily by using a refractometer like DiFluid R2 Extract.
 </img>
And EXT (Extraction Rate) could then be easily calculated as long as you have the other weight info:
EXT = YIELD * TDS / DOSE
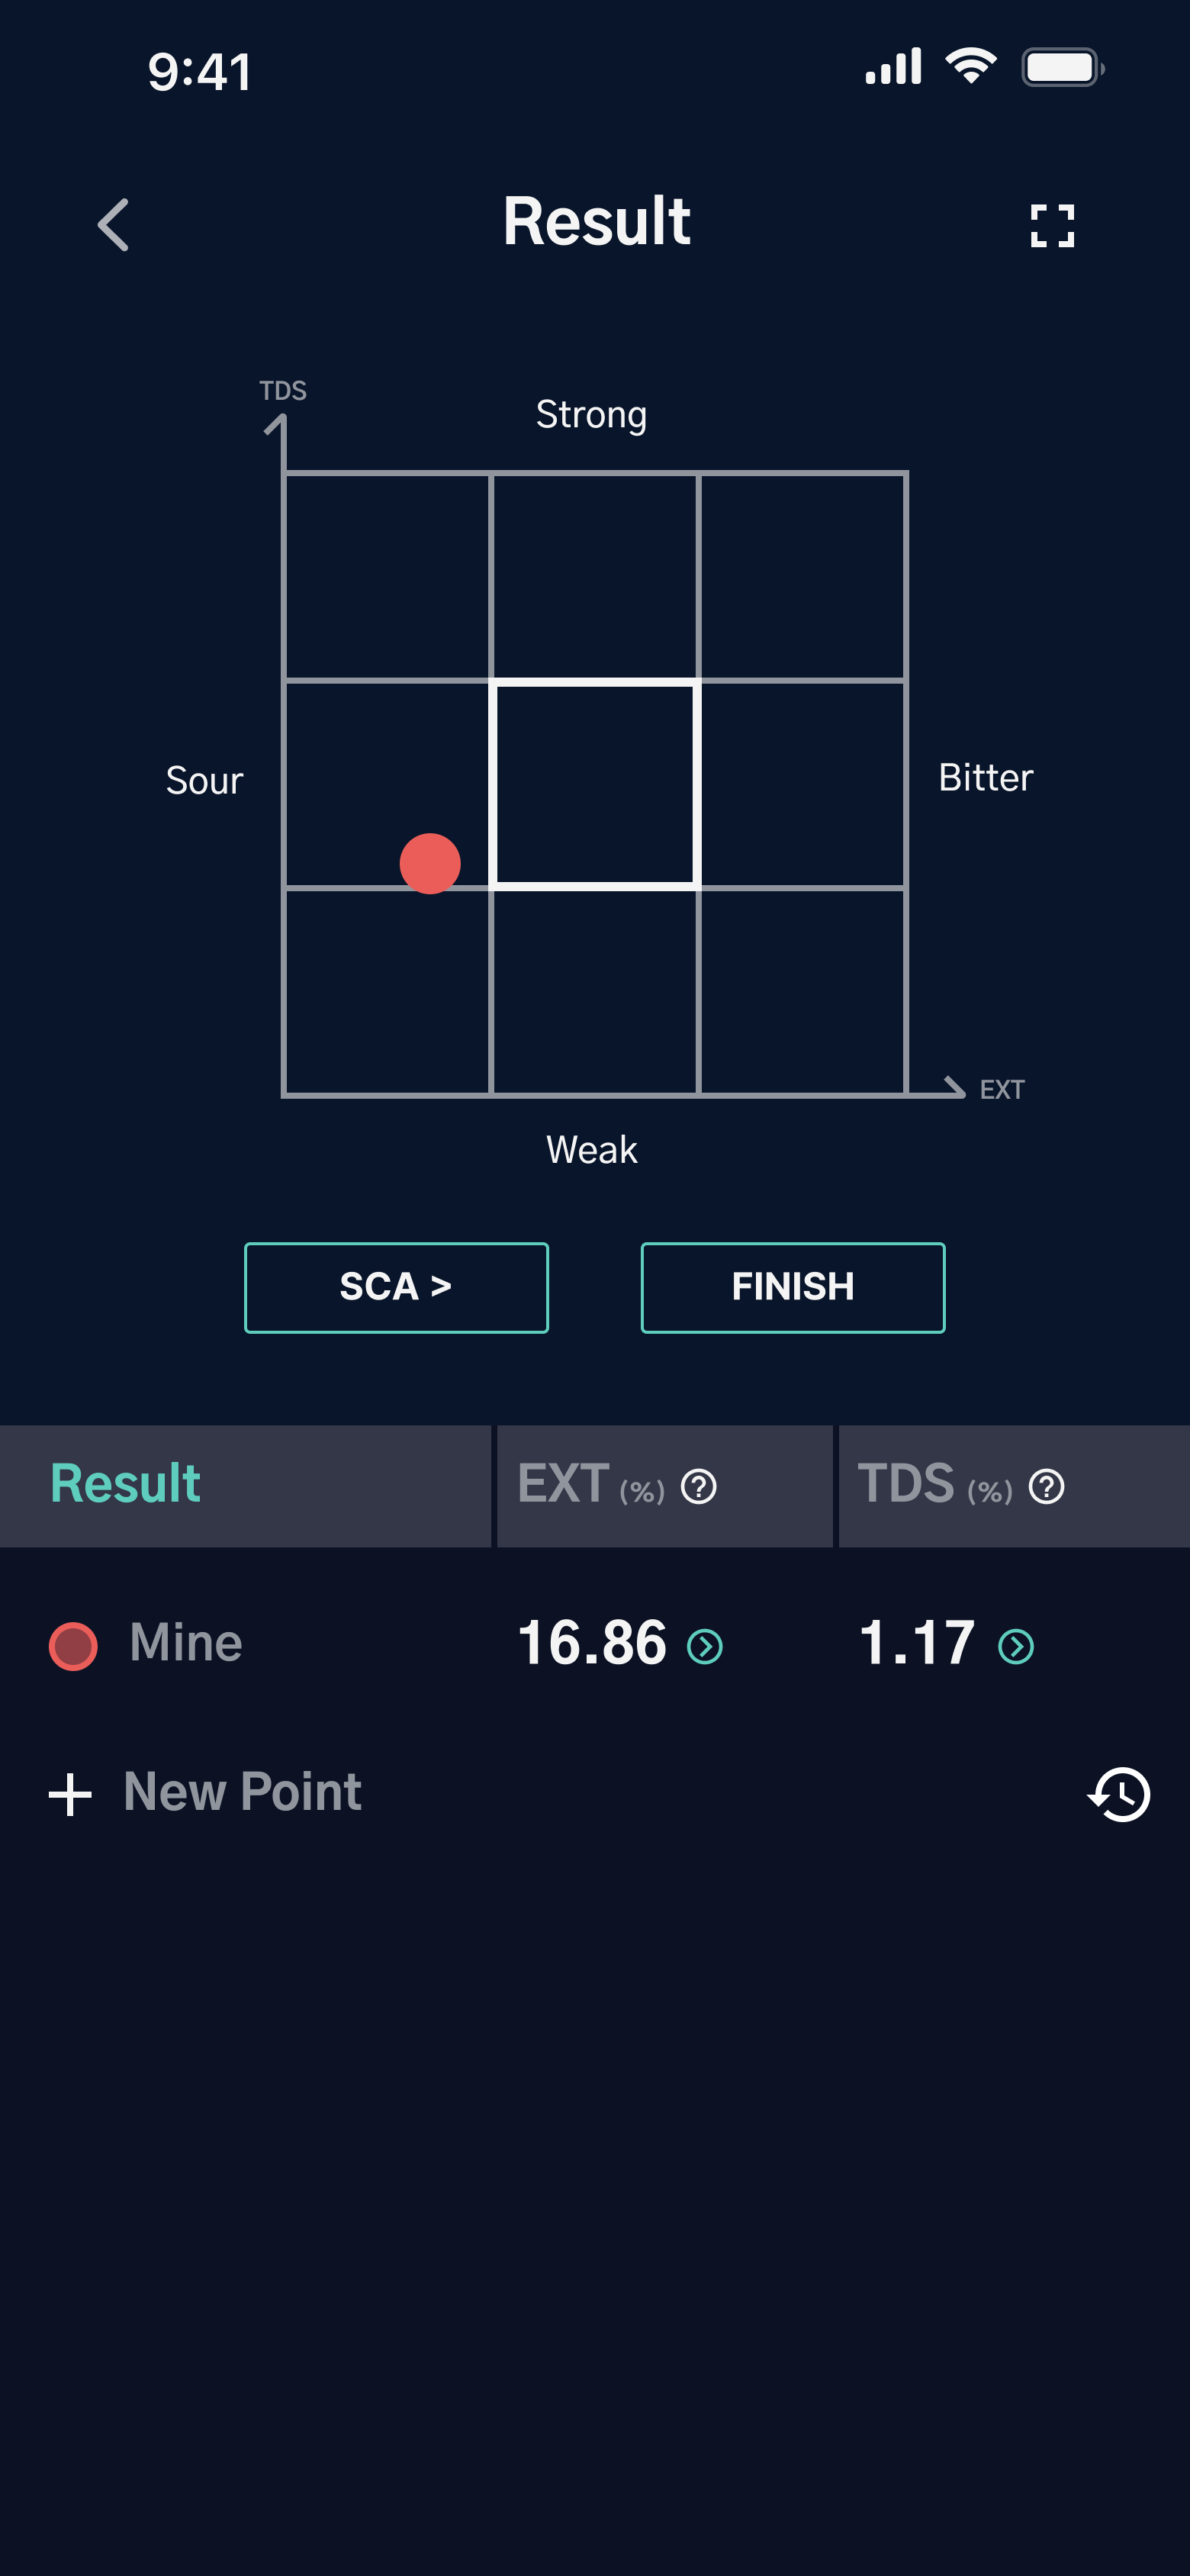
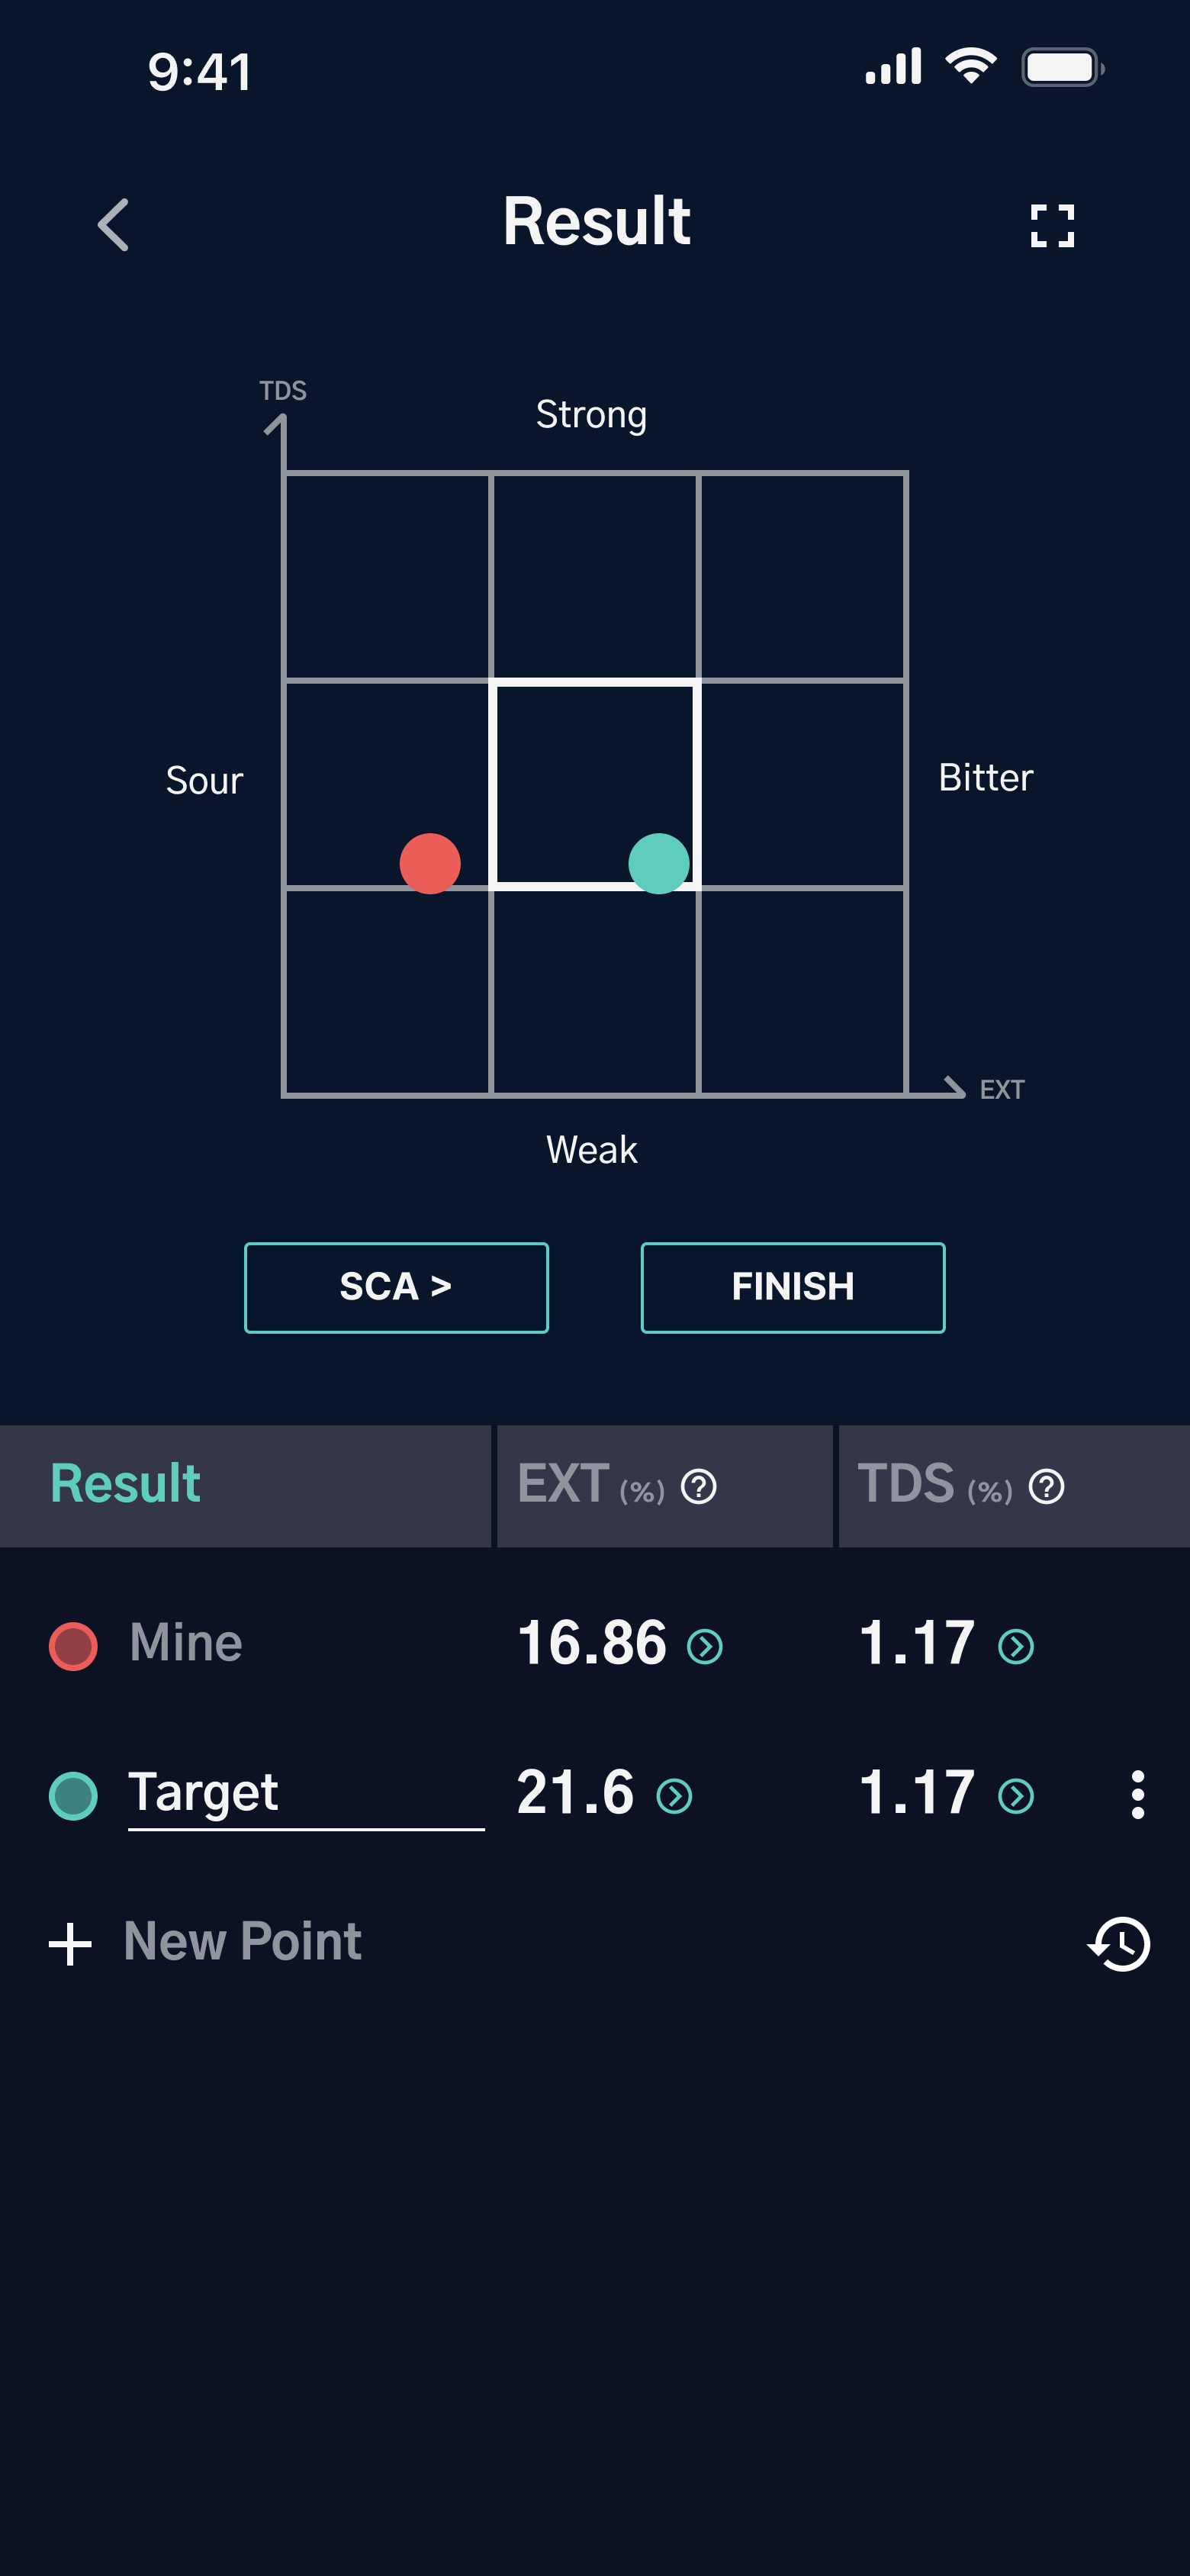
Now I’m going to use one of my morning brew for the demonstration for the following paragraph:
- Dose: 15 Gram
- Water*: 225 Gram
- Yield: 216.15 Gram
- TDS: 1.17%
- EXT: 16.86%
 </img>
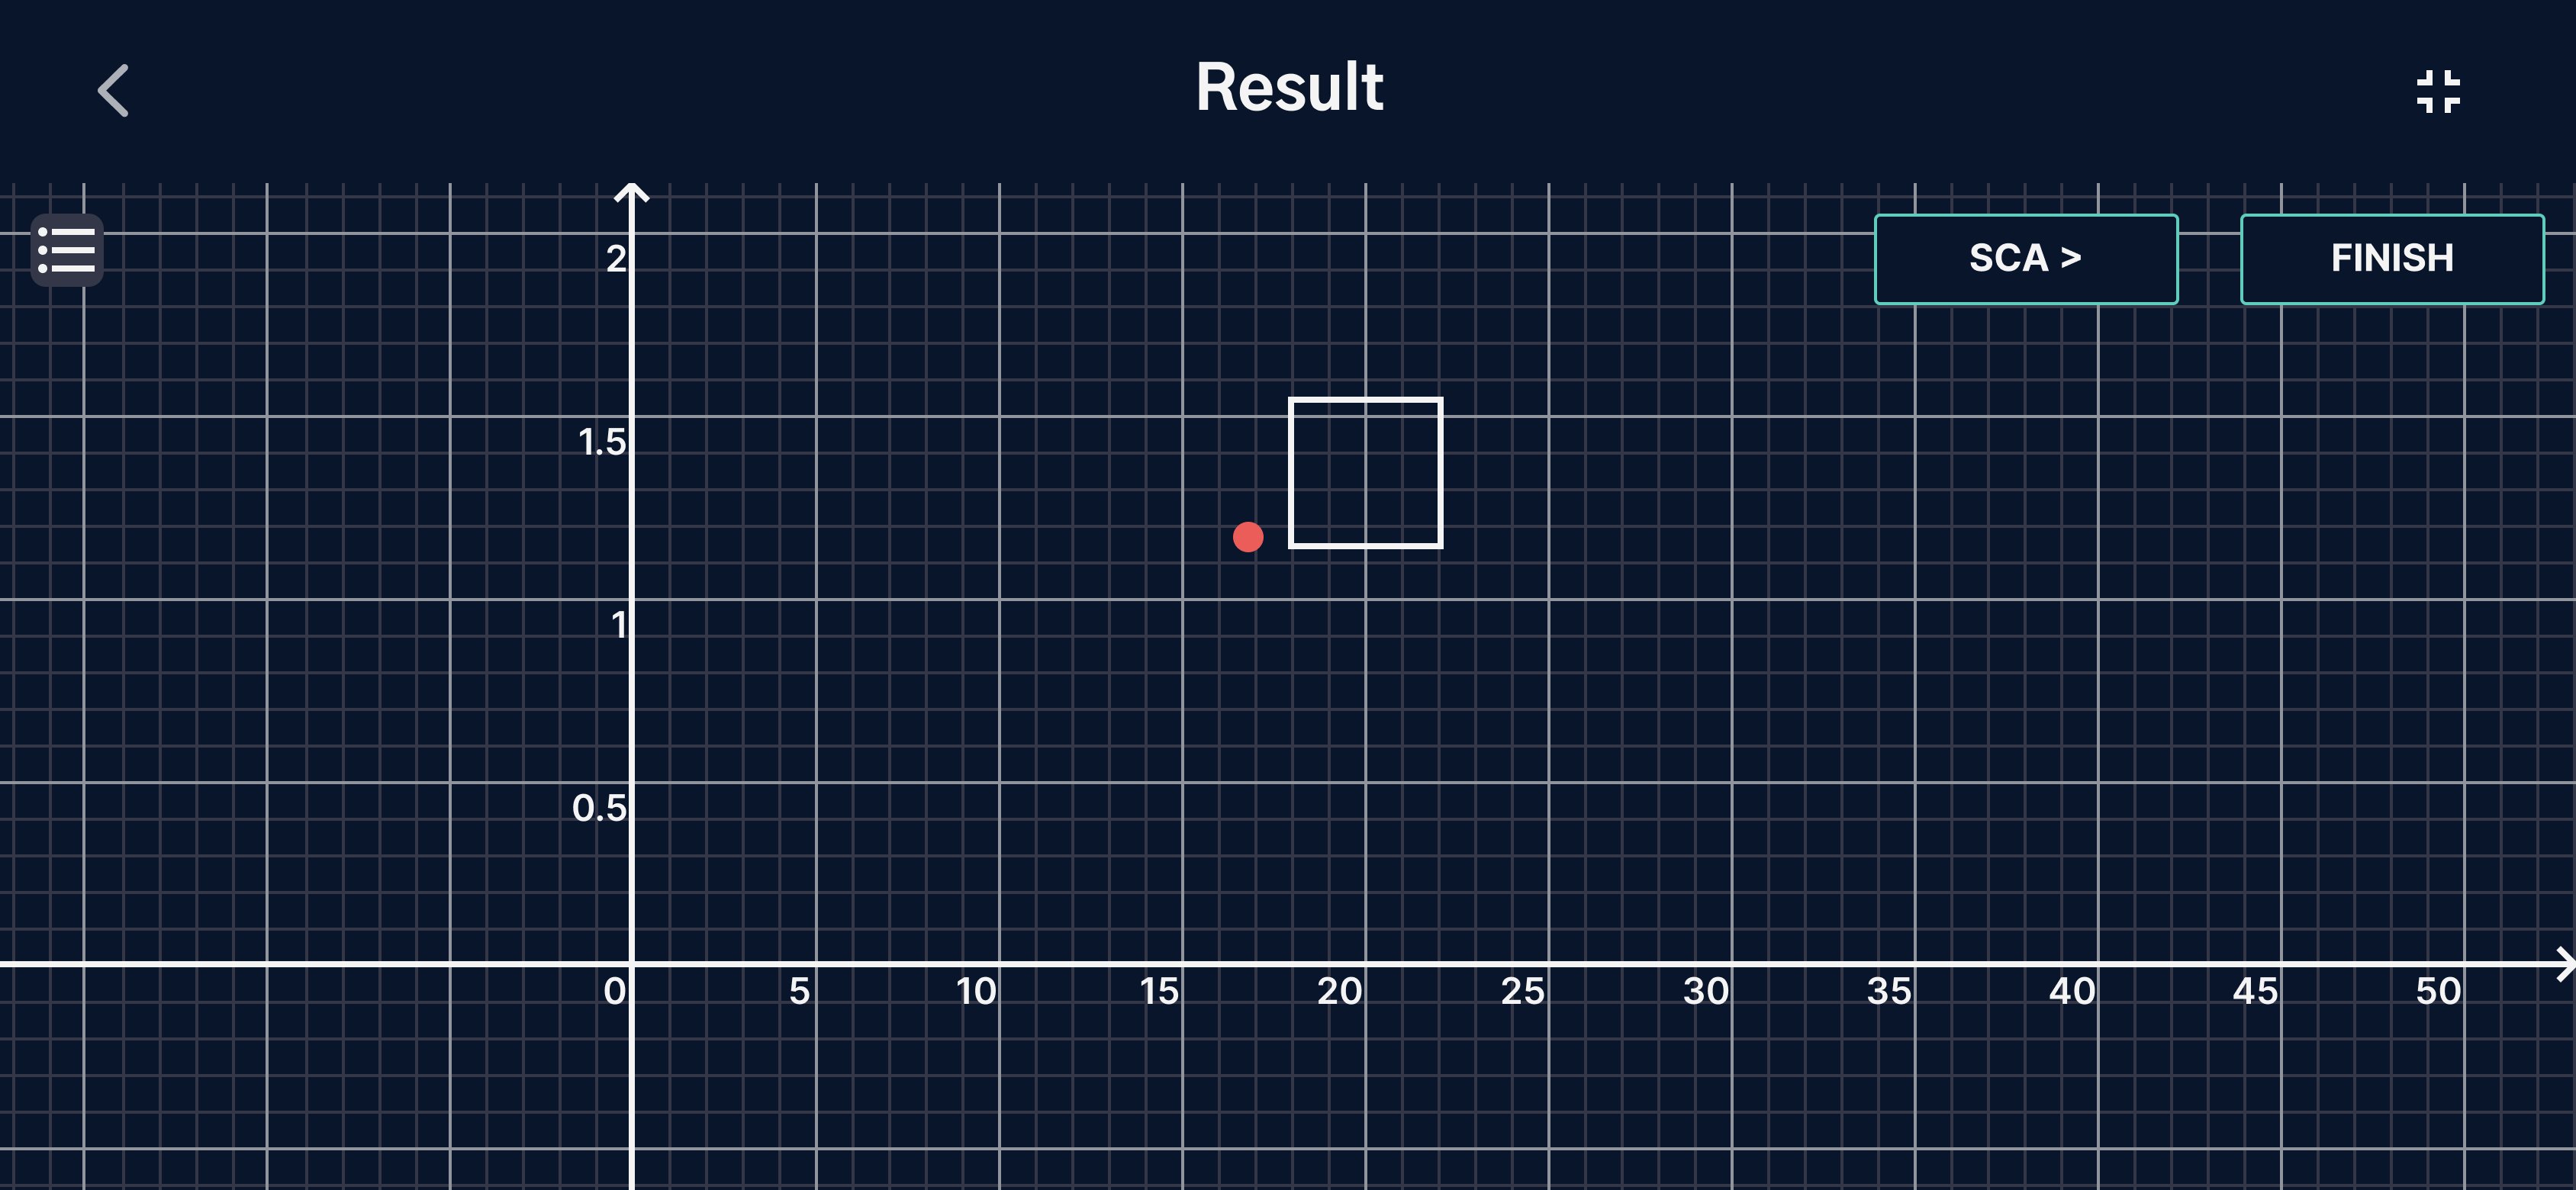
You will see my result is posting on the left part of this brew control chart. While this point position is a relative position to the golden-cup standard you choose. If you refer to the pro-view of this graph, you will see the range of the this standard (here we choosed the latest SCA standard) plotted as a white square range.
 </img>
This square range will change while you switching between different standard, if you want to know about these standards, you can refer to (TODO: golden cup standard introduction).
Here we will just going on with the SCA standard as a reference. Just bear one thing in mind, follow your taste.
🧭 Where to go?
What can I learn from chart?
After getting your point settled on the ‘map’, you will then wondering which direction should I move. But hold on for a moment, and taste your coffee first. Although there are already many standards like SCA Golden Cup Standard giving an ideal extraction rate range, you should rely on your own taste to determine if it’s good or not.
While you are reviewing your coffee, let’s take a brief view on the two axis of ‘map’.
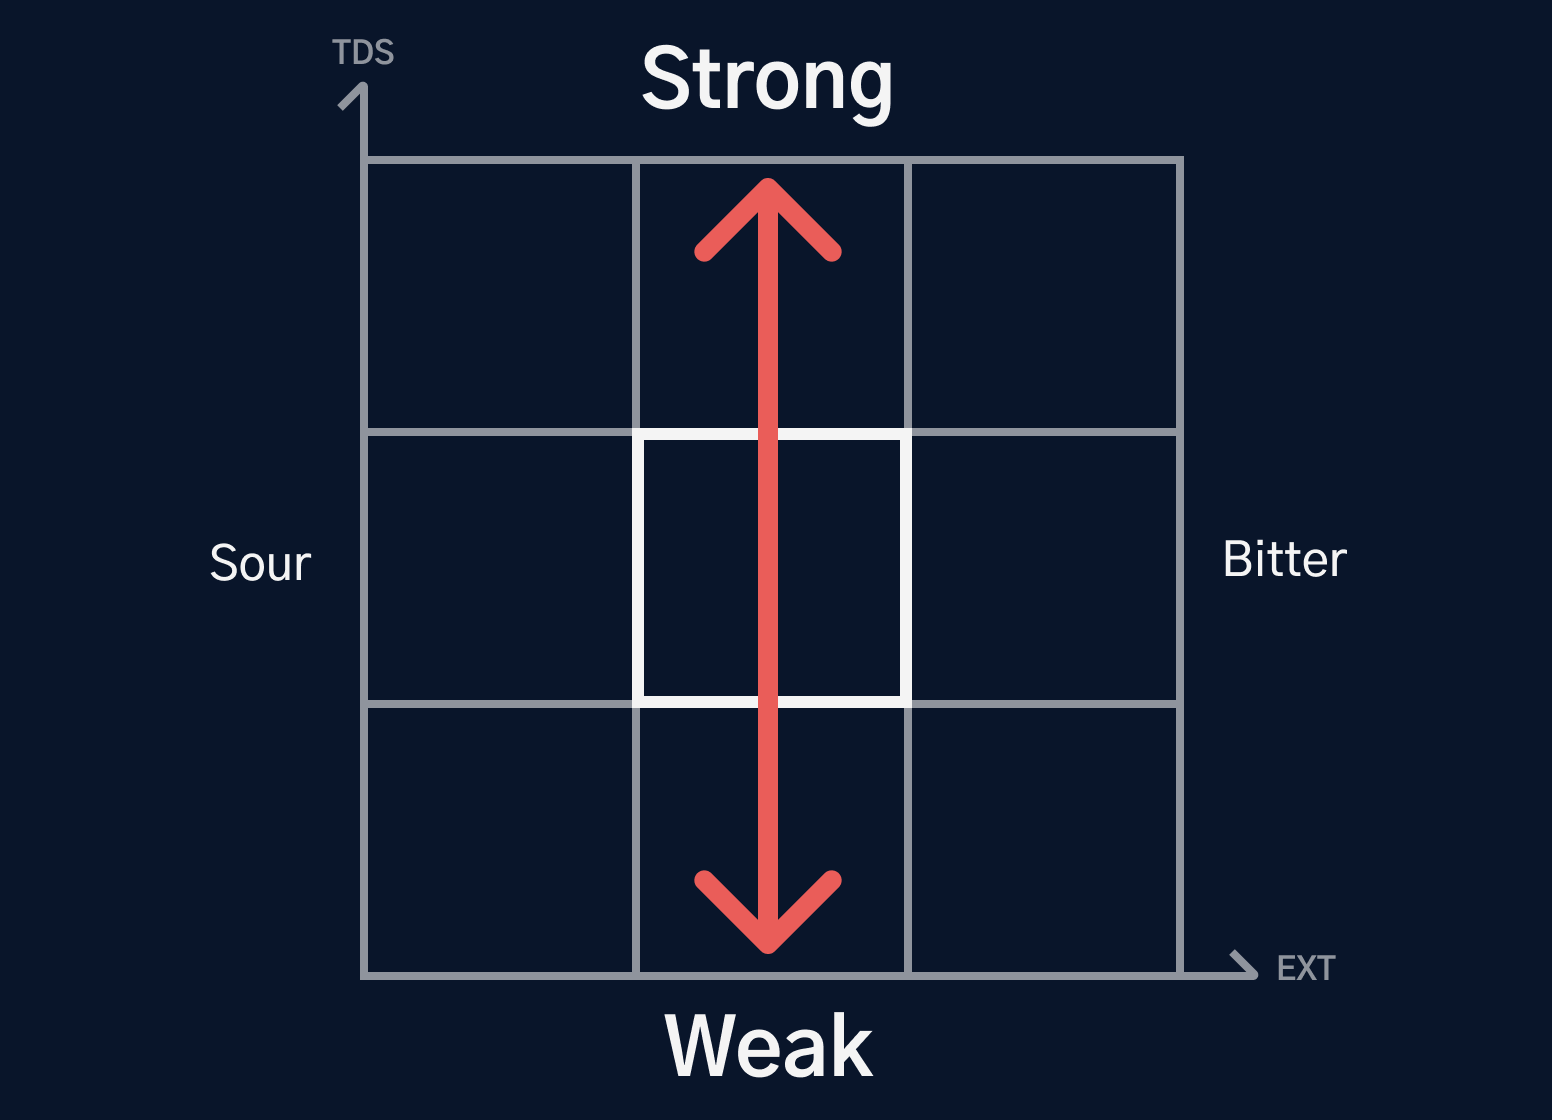
- Verticle Axis - This is the axis showing the strength of your coffee, if you think your coffee is too weak (taste like water) or too strong (flavorful and heavy)
 </img>
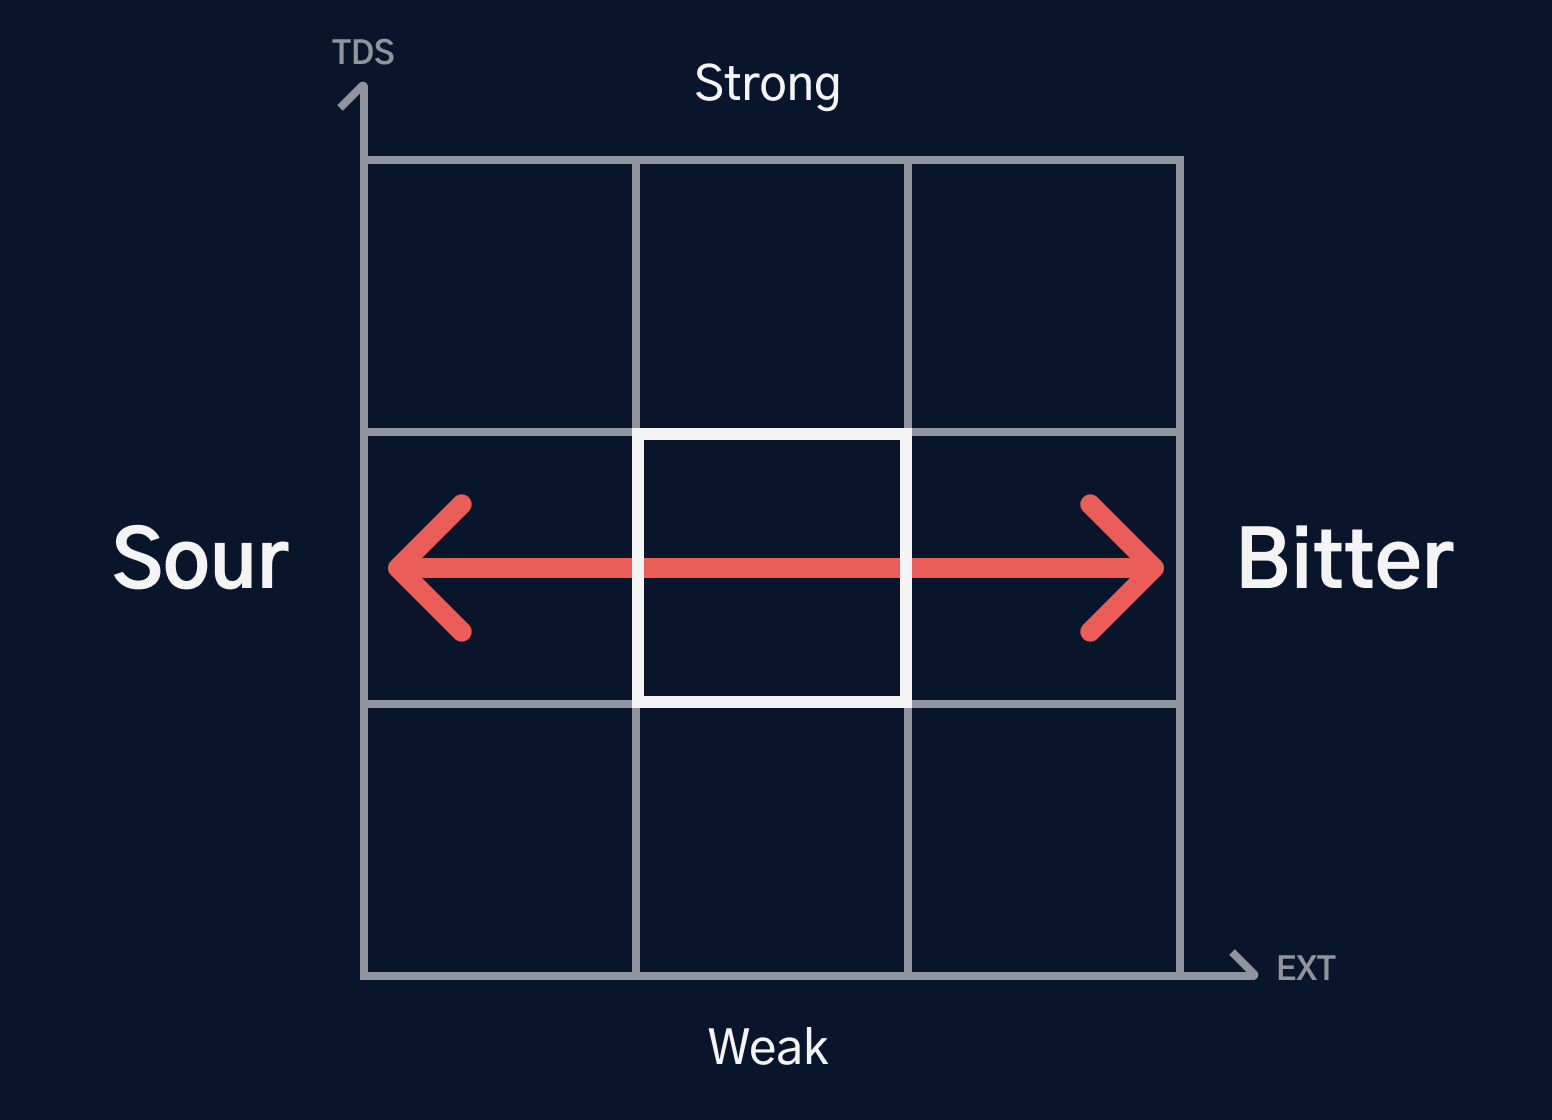
- Horizontal Axis - The over/under-extraction may lead to sour/bitter taste. If you are feeling undesirable sour/bitter taste, then consider moving your point in the reverse direction of it.
 </img>
Okay, now you must be ready to determine your target point according to your subjective review? Still using my morning brew above as an example, it tastes a bit sour but okay for it’s strength, so I’m planning to move the point rightwards a bit. The target is marked as a green point below.
 </img>
🏃♂️ Time to move
How to move my point on chart?
Got your target? Great, let’s head for it! Here’s two basic move you can conduct on this chart:
TODO: Do we need a detailed explanation for these two action about why it will work like this?
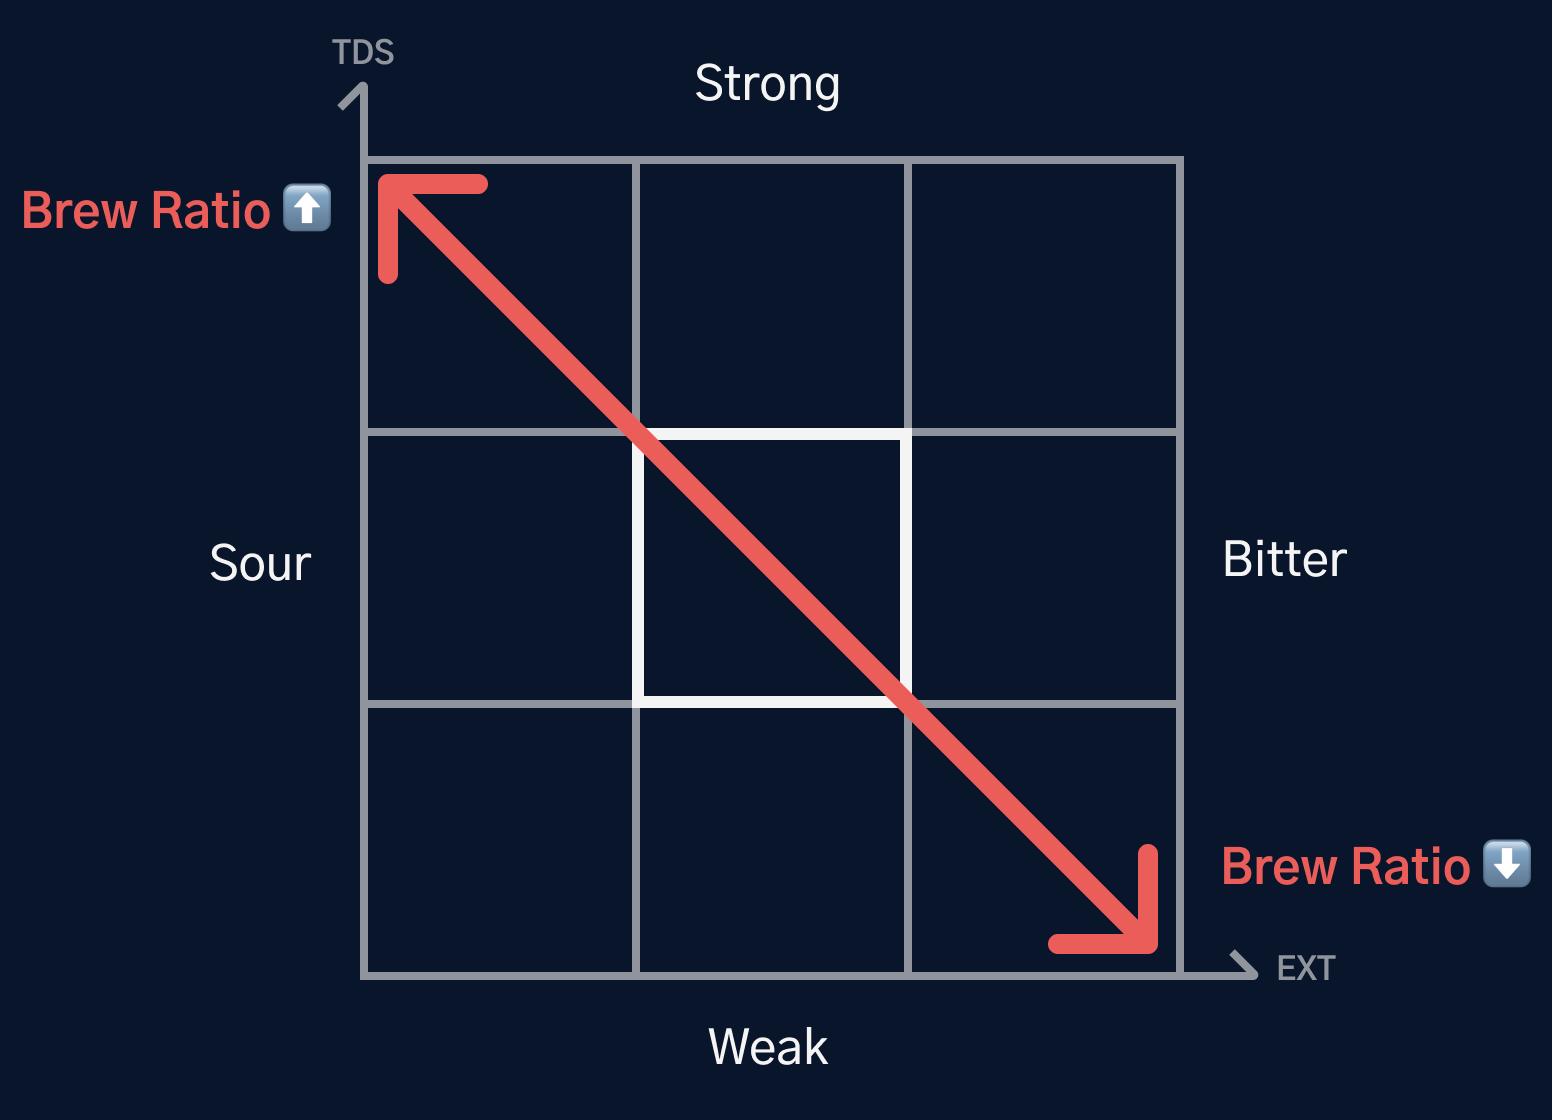
- Change Brew Ratio: Change the dose or water weight along or together, but make sure don’t increase or decrease them together, which won’t change the RATIO of them.
 </img>
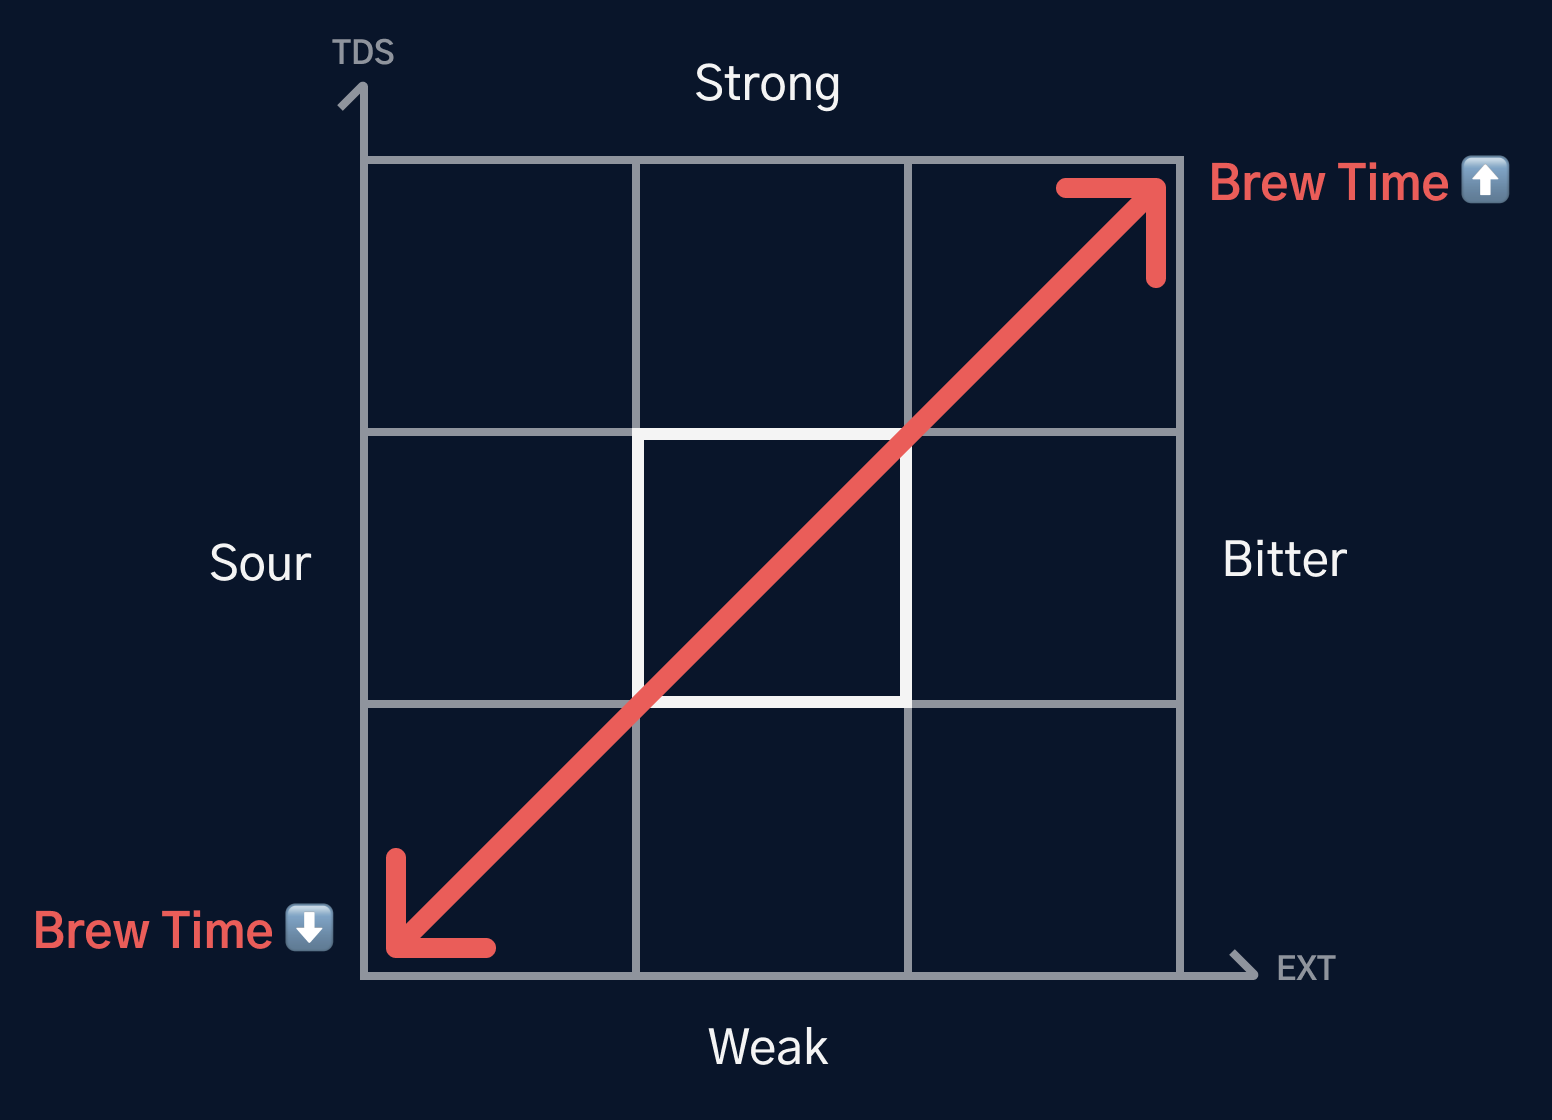
- Change Brew Time: Beside subjective control, grind size, brew tools, brew method, and many other parameters will all affect your brew time, we will talk about them in seperate articles (WIP). You could control it through speed up/ slow down brew process manually for simple.
 </img>
You may notice you don’t have a way to move on the verticle or horizontal axis only, so in most time you have to combine these two basic action to achieve your target.
Let’s get back to my morning brew example, so I want to move my point rightwards, which requires to change Brew Ratio lower and Brew Time longer.
Let me fall back my brew time to 2:10 and cut dose to 15 Gram, and try it again. Indeed for demonstration, I conducted two brew with the first one decreasing the brew time only:
TODO: Video or GIF
And the second one decrease brew ratio depending on the last shot.
TODO: Video or GIF
Then you could see that the actions above all took effect and we successfully moved our step on this map. After reaching the desirable point, don’t forget to take another review.